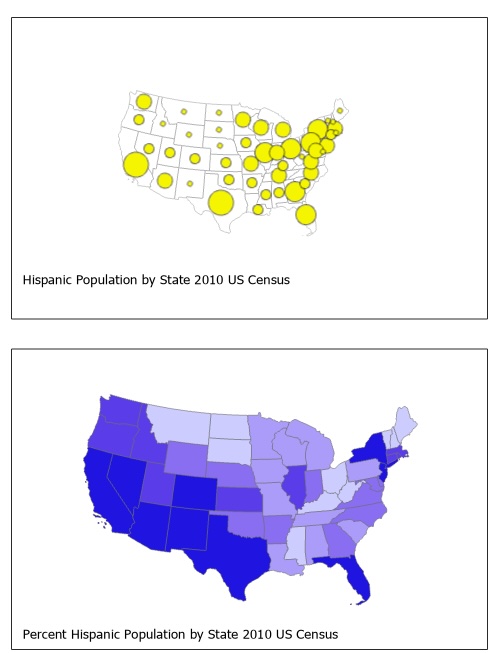
In the provided maps, two types of visualization of the same statistical data set are shown: the total number of Hispanics and the percent of Hispanics in the population by state. The objective of this project was to analyze how different maps could look like based on the same data depending on what type of map one selects for visualization. The proportional symbol map focuses on states having a large total population. The map indicates that there is a large Hispanic population in the states where there is a large total population, for example, California and Texas.
GIS SKILLS USED
- Choropleth mapping (graduated colors)
- Proportional symbol mapping
- Data classification and normalization (totals vs percentages)
- Choosing appropriate symbology
- Visual hierarchy and layout design
- Map comparison and interpretation
- Working with census data
- Projection selection (NAD 1983 Contiguous USA Albers)
As a result of completing this task, I realized the impact that data visualization can make on data interpretation. Even having the same data, one might arrive at completely different conclusions when choosing different methods to visualize it. Moreover, I learned to understand how to choose the type of map according to the questions asked by people. The current task was a good lesson for understanding the importance of proper map design.