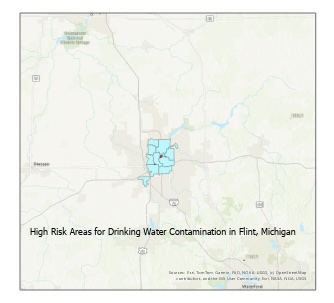
This map shows the areas at high risk in Flint, Michigan due to the contamination of the drinking water, using three risk indicators related to the environment and infrastructure. This is because the study looked at the areas within a radius of 0.3 miles around highly polluted TRI sites, 0.3 miles around the rivers, and 0.2 miles around the lead service pipes. By using the three layers of buffers, the map shows the actual areas of high risk, where the three indicators overlap. From this mapping exercise, it is evident that there is overlapping between environmental risk factors and aging infrastructures, hence, a high probability of the presence of contaminated water.
GIS SKILLS USED
- Coordinate system management (StatePlane Michigan South)
- Converting tabular data to spatial data (XY → point layer)
- Table joins (TRI facilities + water pollution data)
- Attribute selection (pollution > 10,000 tons, lead only)
- Buffer analysis (multiple distances with dissolve)
- Spatial intersection (Intersect tool)
- Multi-layer risk analysis
- Map design and visualization